
Simple Seager
Exploring the power of SEAGER

Y’all know about SEAGER, right? It’s Robert Orr’s creative metric from last fall that measures a hitter’s ability to clobber the right pitch, named after its patron saint Corey Seager? If not, go read up on it first.
When I first read the article, I was blown away. SEAGER is a swing choice metric, like ZoneSw% minus OOZSw%, but smarter. It doesn’t just measure decision skill, it correlates to power. More specifically, it better describes and better predicts isolated power (ISO) and overall hitting skill. Like, a lot better:

SEAGER uses pitch-level, Statcast-derived metrics, accounting for called strike probabilities and expected run values on swings by pitch location, and adjusts for ball-strike count. Here’s the pretty image of differences in run values between a swing and a take based on location and count (more red = more better to swing):
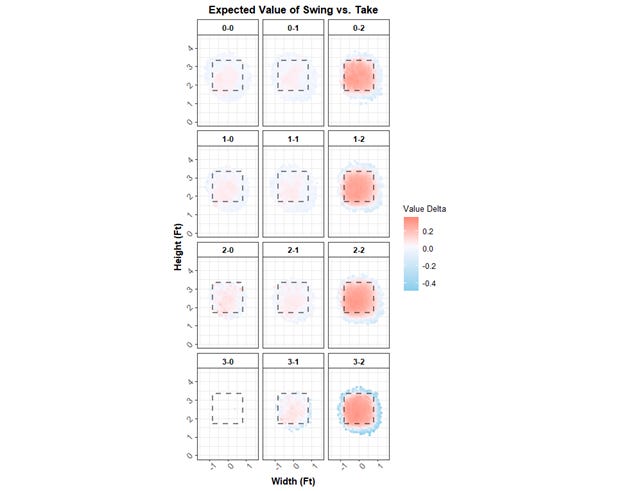
All that sweet Statcast data is taking Z-O Sw% and cranking it up a notch.
Except after revisiting the article this spring, it turns out I was wrong about what SEAGER actually is and what drives its value.
SEAGER isn’t just fancy Z-O Sw%
First (and it’s a long ways down to the second), SEAGER’s not simply fancy ZoneSw% minus OOZSw% (Z-O Sw%). It does subtract two metrics, but they are not analogous. Here’s a basic table that shows the two location options (zone vs out-of-zone for Z-O Sw%, or hittable vs avoid for SEAGER) and the two decision options (swing vs take.) I’ve labeled each of the four options with letters A, B, C and D.

In general, A and D are good choices, while B and C are bad choices. Z-O Sw% distills down to A/(A+C) - B/(B+D). But that’s NOT what SEAGER is calculating. It has different formulas for its two metrics:
Hittable Pitches Taken = C/(C+D) or hittable pitches taken among all pitches taken. Lower is better, so you can take the inverse D/(C+D) if you want something more like ZoneSw%. But either way, the denominator is not zone/hittable pitches, but instead is taken pitches (C+D instead of A+C.)
What does it mean? It’s making the point that among all the pitches you take, you want as few of them as possible to be hittable pitches. You can do that by letting more bad pitches go or by swinging at more good pitches. Via Twitter, Robert mentioned he’s come to view this as a proxy for pitch identification.
Selection Tendency = D/(A+D) or bad pitches taken among all good decisions. This one is even less analogous to its counterpart, OOZSw%, and again the denominators are not the same. OOZSw% has the denominator of B+D while this metric is A+D.
What does it mean? It’s saying that among your good decisions, more of them are unhittable takes vs hittable swings. It’s not obvious to me that higher should be better, but that turns out to be true, generally. Higher points to passivity (not necessarily in a bad way – some great hitters lead the 2023 list, which is topped by Juan Soto), while lower scores point to aggression (maybe in a bad way – fewer great hitters lead the list. Luis Arraez and Luis Robert last year are the only notables among the top 15.) Via Twitter, Robert Orr mentioned he’s come to view this as a proxy for zone awareness.
So what are we to make of the fact that the two metrics that inform SEAGER aren’t actually analogous to Z-O Sw%? A few things, and I think they’re pretty cool:
You can use them on their own! Let’s loose Hittable Pitches Taken and Selection Tendency from the unforgiving shackles of SEAGER, ever to be free!
You can calculate simple versions from freely available stats, instead of relying on someone to run a called strike model and run value on contact model by location and count. You just need four buckets – zone swings, zone takes, OOZ swings and OOZ takes, and follow the formulas above.
You can then, it follows, calculate a Simple Seager. (There’s a joke about naming it after Kyle instead of Corey in there somewhere, but I can’t find it.) In fact, let’s do just that!
To be clear, Simple Seager is going to be the same formula as Seager, but using the strike zone to define good pitches to swing at, instead of Robert’s fancy “hittable pitches by count” smoothed heatmaps. In reference to the table above, Simper Seager = D/(A+D) - C/(C+D)
Below is a scatter plot of 2023 Simple Seager vs Real SEAGER, for players with at least 200 PAs (about 300 players, which is what Robert published. It also excludes Tommy Pham, who showed up with two scores, presumably because he played for two teams.) The two correlate at .72, which is pretty high. A lot of what makes SEAGER great is its formulas, and if *I* can calculate them in R, so can anyone.

is_swing = if_else(description %in% swing_events, 1, 0),
is_in_zone = if_else(zone %in% 1:9, 1, 0),
is_out_zone = if_else(zone > 9, 1, 0)

ss_a = if_else(is_swing==1&is_in_zone==1, 1, 0), #A swings in zone
ss_b = if_else(is_swing==1&is_out_zone==1, 1, 0), #B swings ooz
ss_c = if_else(is_swing!=1&is_in_zone==1, 1, 0), #C takes in zone
ss_d = if_else(is_swing!=1&is_out_zone==1, 1, 0) #D takes ooz
So if SEAGER isn’t just fancy Z-O Sw%, what is it?
I think Hittable Pitches Taken C/(C+D) is the more straight forward piece, penalizing you for not swinging at hittable pitches and swinging at unhittable pitches. Both of those things are bad. The opposite is likely to result in better results: taking good swings at hittable pitches and not taking tough swings at bad pitches. Both of those things should increase ISO.
Selection Tendency D/(A+D) is less intuitive. It’s not obvious to me that higher is better, and yet it correlates well with ISO. Why is taking more bad pitches better than swinging at more good pitches? I think it’s a proxy for how much a pitcher fears a hitter. The causality arrow goes the other way here – if a hitter is capable of a high ISO, pitchers are going to give them fewer good pitches to hit. If a hitter is seeing a lot of hittable pitches and swinging at them, that’s “good”, but why are they seeing so many hittable pitches? Probably because the pitcher doesn’t think damage will be done. On the other hand, hitters that see a lot of unhittable pitches (and let them go) are probably feared. The pitcher would rather risk a walk than serve a meatball.
In other words, while Z-O Sw% rewards hitters for swinging at good pitches and avoiding bad pitches, SEAGER is also detecting how pitchers are approaching hitters to imply their damage potential. SEAGER denominators include both in-zone and out-of-zone pitches, while Z-O Sw% denominators are purely in-zone or out-of-zone.
There are actually six Simple Seager metrics, taking each combination of two quadrants as the denominator, and one of those quadrants as the numerator. For example, ss_ab means A/(A+B). Those six, plus some classic results-based metrics are shown in a correlation table below, using 2024 data through early May. The two that correlate most with ISO are ss_cd (Hittable Pitches Taken, r=-.28) and ss_ad (the inverse of Selection Tendency, r=-.15). That tells me that Hittable Pitches Taken is driving Seager the most. Selection Tendency doesn’t add a lot more than some of the others, although it *does* correlate the most with walk rate.

What about the fancy stuff?
Two (remember, I was listing out the ways that SEAGER isn’t just fancy Z-O Sw%), I’m not sure the coolness of the pitch-level model is actually the defining feature of SEAGER. Based on the correlation of Simple SEAGER to Seager shown above, there’s not a lot of room left in the correlation. I don’t intend this as a slight, I just think it highlights how important the calculation is to the core of SEAGER, likely more important to its value than the fancy stuff. (And I say that as someone who appreciates the fancy stuff.)
Let’s take a closer look at what exactly a “hittable pitch” is. Referring back to the grid of 12 red-blue heat maps above, a hittable pitch is one where the value of a swing is greater than the value of a take, closely tied to pitches in the strike zone, but not exactly. Note that this is a binary definition, throwing out any knowledge of the magnitude of the value difference between a swing and a take. What you essentially end up with is a rounded strike zone that changes size by count. That’s “it”. You lose the fact that it doesn’t matter how red or how blue the location is. You lose the fact that not swinging at a pitch down the middle is way more of a mistake than not swinging at a pitch on the edge. And you lose that swing decisions are significantly more important with two strikes. Not all of those things are necessarily bad – such as weighting two-strike pitches more heavily – but it’s not a feature I picked up on originally.
That’s not all bad news, though, because you could take into account the magnitude of the swing decision choice. Spoiler: I haven’t done that. I’m going to, uh, leave that as an exercise to the reader. But here’s how I would do it:
For each pitch, take the magnitude of the difference in run value between a swing and a take. Treat that as the denominator for each swing choice, instead of 1 for every choice. The numerator is either 0 for a wrong decision or that magnitude for a correct decision. In other words, every swing decision is still either 0% correct or 100% correct, but we’re weighting each one by the magnitude of the choice. Add everything up the same as the formulas above and you now have Double Fancy SEAGER. I’m curious how well that describes and predicts other metrics, or itself. Any takers?
One potential downside to Double Fancy Seager that it makes two-strike decisions much more important than decisions in other counts, generally. That’s probably good for descriptive purposes, but may overpower non-two-strike counts for predictive purposes. You could, perhaps, undo that by de-leveraging two-strike counts so that the average magnitude of pitches seen in each count becomes the same across all counts. Haven’t fully thought that part through.
Thanks for reading! SEAGER’s really cool and I enjoyed thinking it through in more detail. I hope you enjoyed reading my meandering ideas. I’d love to hear your thoughts and ideas in the comments (are there comments on Substack?), on Twitter (@sky_kalkman), or via email (skyking162@gmail.com).
Extra Stuff
Further ideas I didn’t explore related to Simple Seager metrics:
Looking at their prescriptive value
Analyzing more than just 2023 as a comparison to SEAGER and more than just the beginning of 2024 as a comparison to other hitting metrics
Analyzing how fast they stabilize
Further research/article ideas:
Run the Double Fancy SEAGER analysis mentioned above
Split Seager metrics by count buckets, e.g. two-strike or early; how do skills tend to vary by count, and do specific hitters have outlying profiles?
Split hitter Seager metrics by pitch type; what are the pros and cons of each pitch type, and do specific hitters have outlying profiles?
Resources
BPro SEAGER articles:
Google Sheet data for 2023:
Original data from the BPro article
https://docs.google.com/spreadsheets/d/1FIyLmBeGhoG9iV2viQIjM-K1qzZJPQqP7CR7EgUUUEI/edit#gid=0My Simple Seager data
https://docs.google.com/spreadsheets/d/e/2PACX-1vRAiFazHzeqfBFXPqUICNg59TPOIEbhmHM5dpId5uNcE2zkcJZ4_f5Qud9vGT2oR17iQ_G-c1Oq_Oit/pubhtml?gid=632424469&single=true
R stuff:
Drew Haugen’s awesome intro to Statcast data
https://drew-haugen.netlify.app/posts/exploring_statcast/exploring_statcast_data_in_r.htmlCorrplot package guide
https://cran.r-project.org/web/packages/corrplot/vignettes/corrplot-intro.html